Untimely Dip in County Jobs Rate Is Ominous Sign : Economy: A 2.7% drop in construction positions during a usually busy month brings overall August rate down 0.4%. But unemployment also declines.
- Share via
ANAHEIM — Led by a dramatic 2.7% drop in the number of local construction jobs, and a much smaller but significant decline in manufacturing positions, total employment in Orange County dropped by 5,400 jobs, or 0.4%, in August.
It was the first time since the real estate depression of 1982 that construction employment in the county has dropped from July to August, the traditional peak building season, according to the state Employment Development Department.
And the loss of 900 manufacturing jobs--after a similar drop in July--supports earlier predictions by local economists that 1990 could become the first year on record in which the number of manufacturing jobs in the county failed to grow.
Despite the drop, the county’s unemployment rate--which measures percentage of local residents employed, not total jobs--fell to 3.3%, from 3.6% in July, according to state figures. The county’s jobless rate continues to be one of the lowest in the nation.
Eleanor Jordan, EDD labor market analyst for Orange County, said the August decline in total jobs was not unusual except for the steep drop in construction employment.
The number of county-based jobs fluctuates substantially from month to month, she said, because of seasonal factors.
Thus, employment totals almost always rise substantially in November, when retailers begin Christmas hiring, and drop in June, when school workers get off for the summer. In August, Jordan said, job levels are usually affected by seasonal decreases in agriculture and school employment.
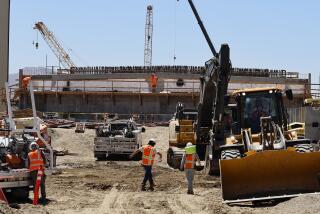
What made last month different was that the construction slump finally made itself felt in the county, with a major decrease in building trades jobs. Total employment in the industry plunged from July’s 71,000 to 69,100--a loss of 1,900 jobs.
The only other time a July-to-August decline has taken place since the state began tracking that data in 1972 was in 1982, Jordan said, when the number of construction industry jobs in the county fell to 31,300 from 31,800 in July--a 1.6% drop.
Since August, 1989, when the total construction jobs in the county hit 75,600, employment in the industry has dropped by 8.6%.
“We’ve been dropping steadily for the past several months, so a loss of nearly 2,000 jobs tells me we’re in a recession,” said Bill Perry, executive secretary-treasurer of the Orange County and Vicinity District Council of Carpenters. “It’s just that most people haven’t felt it yet.”
The council, with headquarters in Orange, represents 10,000 union carpenters in Orange, Riverside and Imperial counties.
The state’s figures support other signs this week that the county is in a real estate recession reflecting a general economic malaise.
On Tuesday, figures were released by two real estate research firms, showing that home sales in August had tumbled from year-earlier figures, with resale activity down 23% and new-home sales off 42.4%. On Wednesday, it was reported that construction lending in the state had in August hit its lowest level in at least 20 months. In Orange County, just $170 million in construction loans were made during the month, down 51% from August, 1989.
Although scant comfort to an out-of-work carpenter or dry-wall installer, the loss of construction jobs in the last year has been offset by gains in the county’s service employment, principally in the wholesale and retail trades, business and financial services and transportation and public utilities industries, Jordan said.
Employment growth has been slowing all year, as the economy has cooled down. August’s employment was 1,222,400, compared to 1,227,800 in July. But August figures are up 1.8% from 1989, when total employment was 1,200,300. That 1.8% annual growth rate, however, contrasts with a growth pace of from 4% to 8% a year in the mid-1980s.
One other softening local employment trend has been in manufacturing, which has been declining as a percentage of total employment in the county for more than two decades. But until this year, the actual number of manufacturing jobs has increased each year.
Both Jordan and Chapman College economist James Doti have said that may change this year. And with a 900-job drop in August and an 1,800-job decline since June, local employment totals now show county manufacturing jobs down by 2,000 from the August, 1989, total of 259,100.
The numbers do not bode well for the local economy, Doti said: “An even more sobering thought is that when employment is growing rapidly or declining faster than usual, the monthly EDD reports are usually underestimated.”
That could mean that the slowdown is more pronounced than the on-the-spot look at the numbers indicates, he said.
“I wouldn’t be surprised if, when the revisions come out next year, the numbers aren’t even more pessimistic than they look now,” he said.
SLOW GROWTH FOR EMPLOYMENT IN O. C.
Job growth within Orange County has slowed to a crawl, with significant declines over the past year in several industries.
Wage and Salary Employment
(in thousands)
Industry Aug. 1989** Aug. 1990** % CHANGE Agriculture 7.9 5.6 -29.1 Construction 75.6 69.1 -8.6 High-tech manufacturing 87.7 87.1 -0.7 Total manufacturing 259.1 257.1 -0.8 Trans.& Utilities 30.8 36.1 +17.2 Wholesale Trade 78.4 81.7 +4.2 Retail Trade 226.3 229.3 +1.3 FIRE* 96.3 98.6 +2.4 Business/Pers.Services 313.6 325.5 +3.8 State/Local Government 94.7 101.6 +7.3 Total Service-Producing 856.3 889.3 +3.9 TOTAL JOBS 1,200.3 1,222.4 +1.8
* Finance, Insurance, Real Estate.
** (in thousands)
Source: California Employment Development Department
More to Read
Sign up for Essential California
The most important California stories and recommendations in your inbox every morning.
You may occasionally receive promotional content from the Los Angeles Times.


